Local Data Insight Subscriber Support

As a Local Data Insight subscriber you have the information to transform your communities in the most meaningful way, right at your fingertips. The location-specific data can help you better focus your resources, inform your decision-making and increase your impact.

On this page you will find details of the regular updates we make to Local Data Insight to continually improve your experience

 

August 2024 update

Following the launch of Local Data Insight, the below updates are enhancements to the platform in usability and to help provide details on how to access the functionality.

Please note, when using Local Data Insight in general it is recommended to view in full screen to be able to view a wider range of data.

MSOA conversion name within the platform is now available, and not only the MSOA ward name. This report is available for all users now.

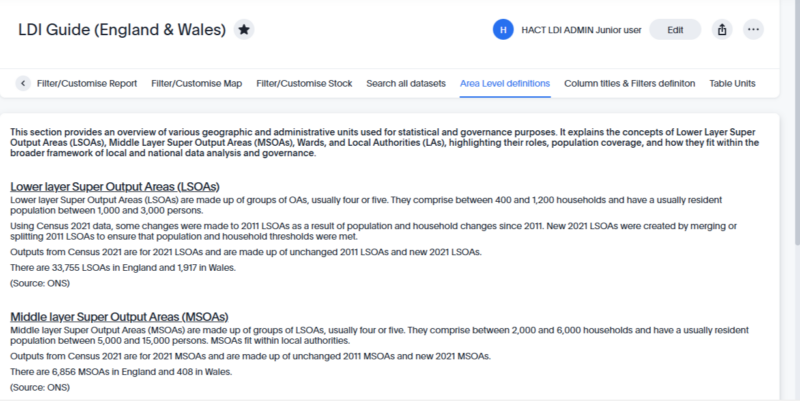
The LDI guide has been enhanced with more information. The following tabs have been included:

  • Area level definitions
  • Custom titles & filters definitions
  • Table units tab

There is also now a clear step by step guide within filter/ customise report tab and search all datasets tab.

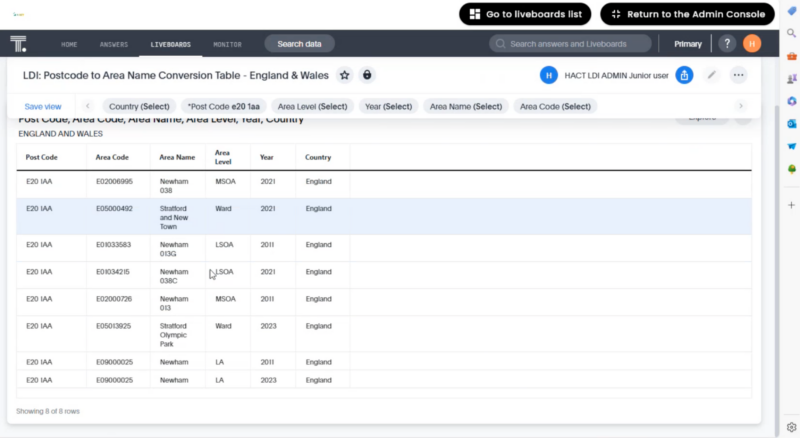
There is now available a table in this section to find out which area name corresponds to the relevant postcode. The table has the names of the reports for LA names, MSOA names and LSOA names.

July 2024 update

A condensed report is now available for:

  • England & Wales for LA, MSOA and LSOA
  • Scotland LA, IZ and DZ.

It is recommended that these condensed reports be used for exporting reports.

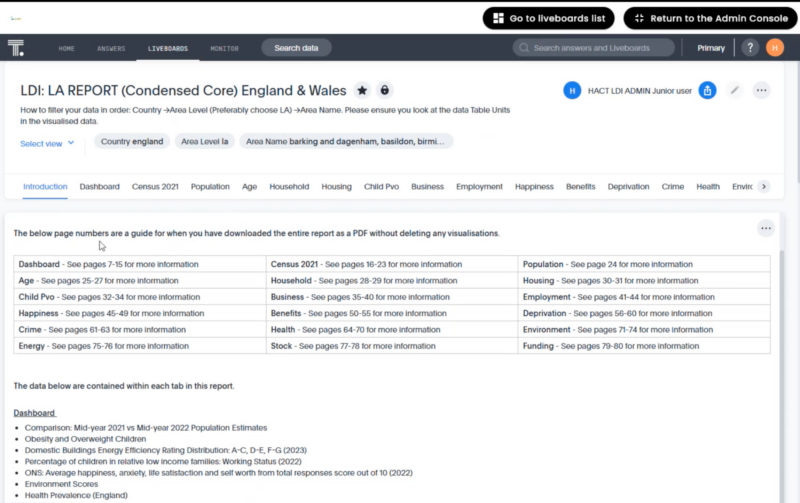
Within the condensed report there is an index page at the start of the condensed report for users to know which data is contained within each data tab of the report. There is also an index/ introduction page number for when users export the report to know where to quickly find the data in the report.

The condensed report also includes a dashboard containing the most useful data.

Condensed report LDI

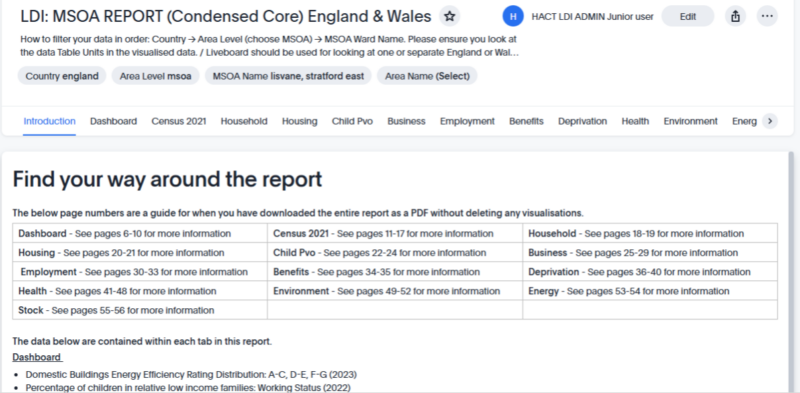
Screenshot of new condensed report for England & Wales, displaying the index page for the LA report

Condensed report dashboard

Screenshot of new dashboard within condensed LA report for England and Wales

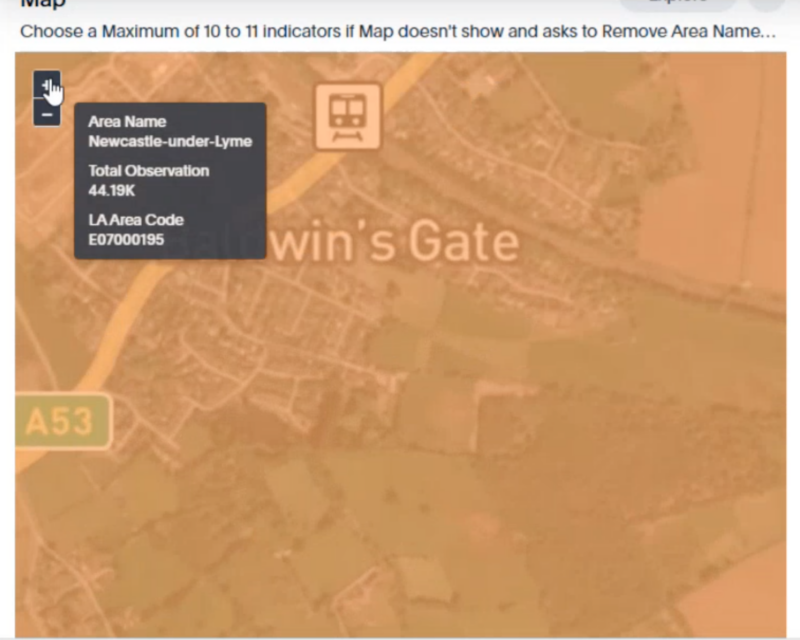
All the England/Wales and Scotland maps have been updated for the map view to be more detailed so that when customers zoom into the map they can see the streets names. It is now possible to hover over the map to see the name of the area. Also, if you right-click on an area it will show the data for that specific area in the reference table below. 

detailed map

Screenshot of street detail when zoom in on map detail

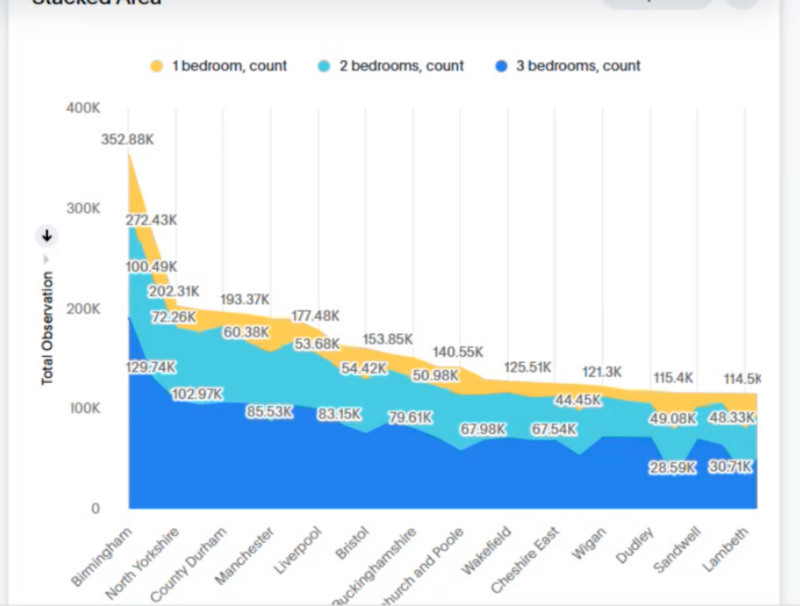
The maps now include a visualisation of selected data sets for different areas to see how the areas compare. This is via a stacked graph.

Stacked graph for mapped area

Screenshot of stacked graph visualising datasets across different mapped areas

If you are unsure of the ward name of the area you’re concerned with, you can use the map to display all areas of an LA (see below example for Newham LA), use the map to then find the area of interest geographically; this will then display the ward name of that area. You can at this stage select multiple areas to create boundaries.

MSOA map view

Screenshot showing all areas of Newham Council on MSOA display, highlighting each ward name of that local authority


New user guides are available that will continue to be updated with information and useful tips across different topics. This is split up into the following areas:

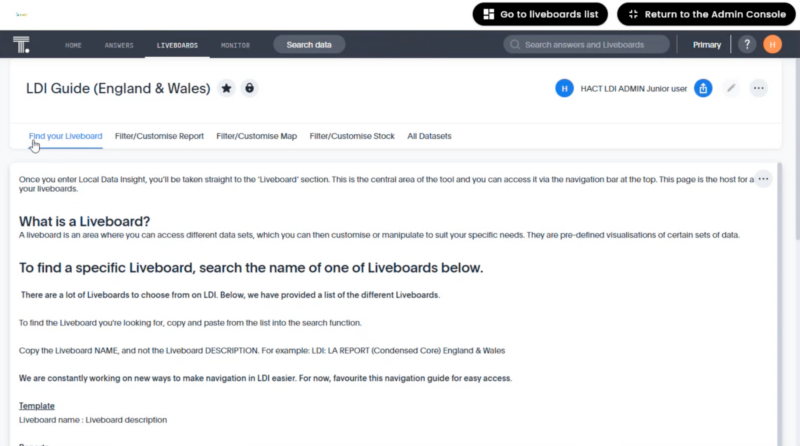
  • Find your Liveboard
  • Filter/ customise report
  • Filter/ customise ma
  • Filter/ customise stock
  • Full set of datasets – this drills further down into the datasets and indicators within themes (for example religion)
LDI guide

Screenshot of LDI guide for England and Wales


dataset screenshot

Screenshot of exploring the different datasets using filters in the guide

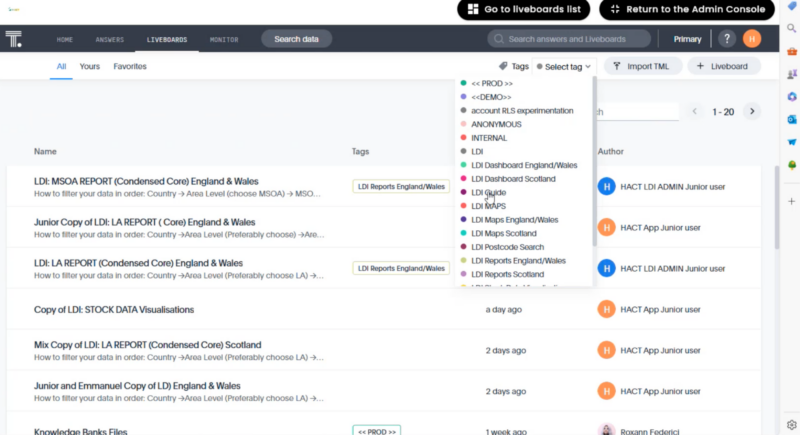
Tags have been created to make it easier to find the most relevant information. They are a way to access different liveboards, these have been created by HACT. You can explore these at the top of the liveboards screen.

tags screenshot

Screenshot of tags options available as a drop down at the top of each screen

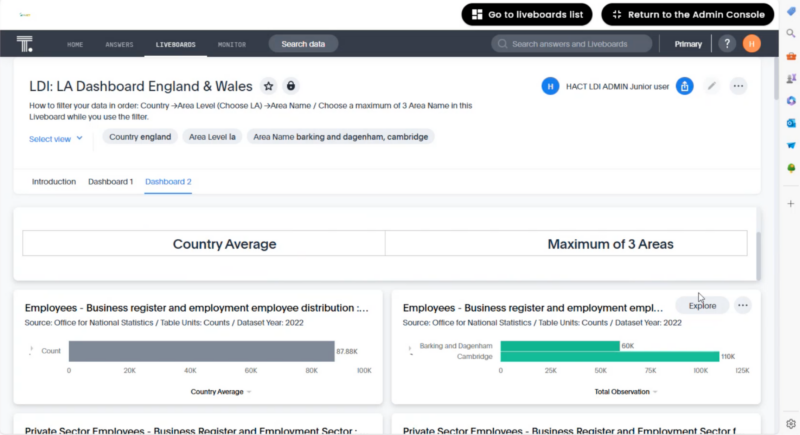
Dashboards have been created as an easy way to look at the data of an area.

Each dashboard includes an introduction tab that outlines the data used in the liveboards and a tab for each dashboard available. Within the dashboards, you can, like all liveboards, filter the information to your chosen area.

dashboard screenshot

Screenshot showing dashboard 2 for England & Wales displaying country average of employees vs the selected areas

A liveboard is now available which can be used to search postcodes to match up with the correct area names for LA, MSOA and LSOA. This liveboard can be accessed via the new tags.

postcode search screenshot

Screenshot showing postcode for E20 and the corresponding area names

We're here to help

We know that using any online tool can take time, that’s why we’re here to support you. Our team are on hand to provide training for you and your colleagues to make sure you are using it as effectively as possible for what your organisation needs. Our platform also hosts handy support guides and how-to videos to get you started.

If you would like to discuss any questions with our team or organise further training, please get in touch.

Get in touch